Crashworthiness of Carbon Fiber Composites
Instructions for Test Data Analysis
Instructions are copied from the project High Strain Rate Characterization of Magnesium Alloys. The process for analyzing data from the composite crashworthiness tests on this web site is essentially the same, and can be performed by following the steps below.
Step 3: Display and Download Data
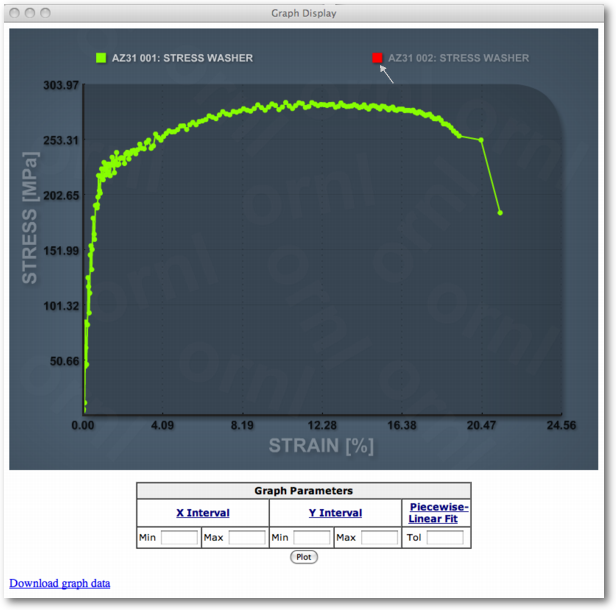
If selected data from the tests is compatible, a new window with the resulting graph will open.
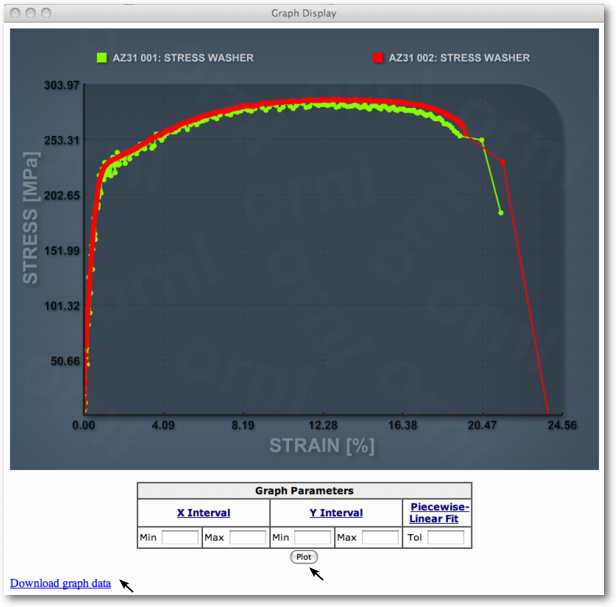
The data region of interest can be modified by specifying X Interval and Y Interval and pressing the Plot button. Data can be downloaded by clicking on Download graph data link. Print or save the graph image by mouse right-click inside the graph.
To reset a specific limit of the display region, just delete the content of the respective Min and/or Max boxes.
Data curves can be toggled in the graph display by clicking on the curve labels in the legend.