Battery Markup Language (BatML) Standard
Example Models for Batteries
Example 1: Unrolled Cell (Electrochemical/Thermal)
In this example (located at in the VIBE depository at trunk/examples/case1/), we simulate the unrolled cell described in Srinivasan and Wang (Srinivasan and Wang 2003). The main model inputs for the simulation are provided in the table below:
| Physical Properties | Units | Total | Carbon Electrode (Anode) | Lithium Electrode (Cathode) | Separator |
|---|---|---|---|---|---|
| Density (r) | Kg/m3 | 2500 | 1500 | 1200 | |
| Heat Capacity (Cp) | J/Kg-K | 700 | 700 | 700 | |
| Thermal Conductivity | W/m-K | 0.01 | 0.01 | 0.01 | |
| (rCp) avg | J/m3-K | 175x104 | |||
| Height | m | 0.5 | |||
| Width | m | 0.024 | |||
| Thickness | m | 394x10-6 | |||
| Current Density | A/m2 | 35 | |||
| Convective Heat Transfer Coefficient | W/m2-K | 25 |
The battery state file for this example is schematically shown in Fig. 1. The unrolled cell domain is decomposed into zones along the axis based on the expect temperature gradients. Each zone calls its own version of DualFoil. The DualFoil calculations provide the heat source for each of the zones. The thermal component calculations update the temperatures for the each of the zones for the DualFoil calculations. The typical results from these simulations are shown in Fig. 2. As seen in the results, the solution deviates the most with one-way loose coupling and as we increase the degree of coupling (by exchange of information and also using more number of zones), the peak temperature approaches 80˚C – the solution from the fully coupled solution (Srinivasan and Wang 2003).

Figure 1: Battery state file for example 1.

Figure 2: Sample results (electrolyte and electrode potential and concentration, and temperature) for example 1.
References:
-
Srinivasan, V. and C. Y. Wang (2003). "Analysis of Electrochemical and Thermal Behavior of Li-Ion Cells." Journal of the Electrochemical Society 150(1): A98-A106.
Example 2: Unrolled Cell (Electrochemical/Electrical/Thermal)
In this example (located in the VIBE repository at trunk/examples/case2/) we have added the current collectors to the previous example configuration. The main model properties are provided below. The corresponding schematic for the model’s battery state is given in Fig. 3. Electrical resistance (from DualFoil) and heat source (from Electrical) is stored in the battery state and this information is used by the electrical and thermal component models, respectively. The simulation results are shown in Fig. 4. Comparing Fig. 4 and Fig. 2, we can see a decrease in the temperature rise in the case when current collectors are present because they promote faster dissipation of heat generated by electrochemistry.
| Physical Properties | Units | Total | Carbon Electrode (Anode) | Lithium Electrode (Cathode) | Al Foil | Cu Foil | Separator |
|---|---|---|---|---|---|---|---|
| Density | kg/m3 | 2500 | 1500 | 2700 | 8960 | 1200 | |
| Heat Capacity | J/Kg-K | 700 | 700 | 900 | 385 | 700 | |
| Thermal Conductivity | W/m-K | 0.01 | 0.01 | 238 | 398 | 0.01 | |
| Electrical Conductance | S/m | 0.0051 | 0.0051 | 383x105 | 633x105 | 0.0051 | |
| (rCp) avg | J/m3-K | 175x104 | |||||
| Height | m | 0.5 | |||||
| Width | m | 0.024 | |||||
| Thickness | m | 394x10-6 | |||||
| Current Density | A/m2 | 35 | |||||
| Convective Heat Transfer Coefficient | W/m2-K | 25 |
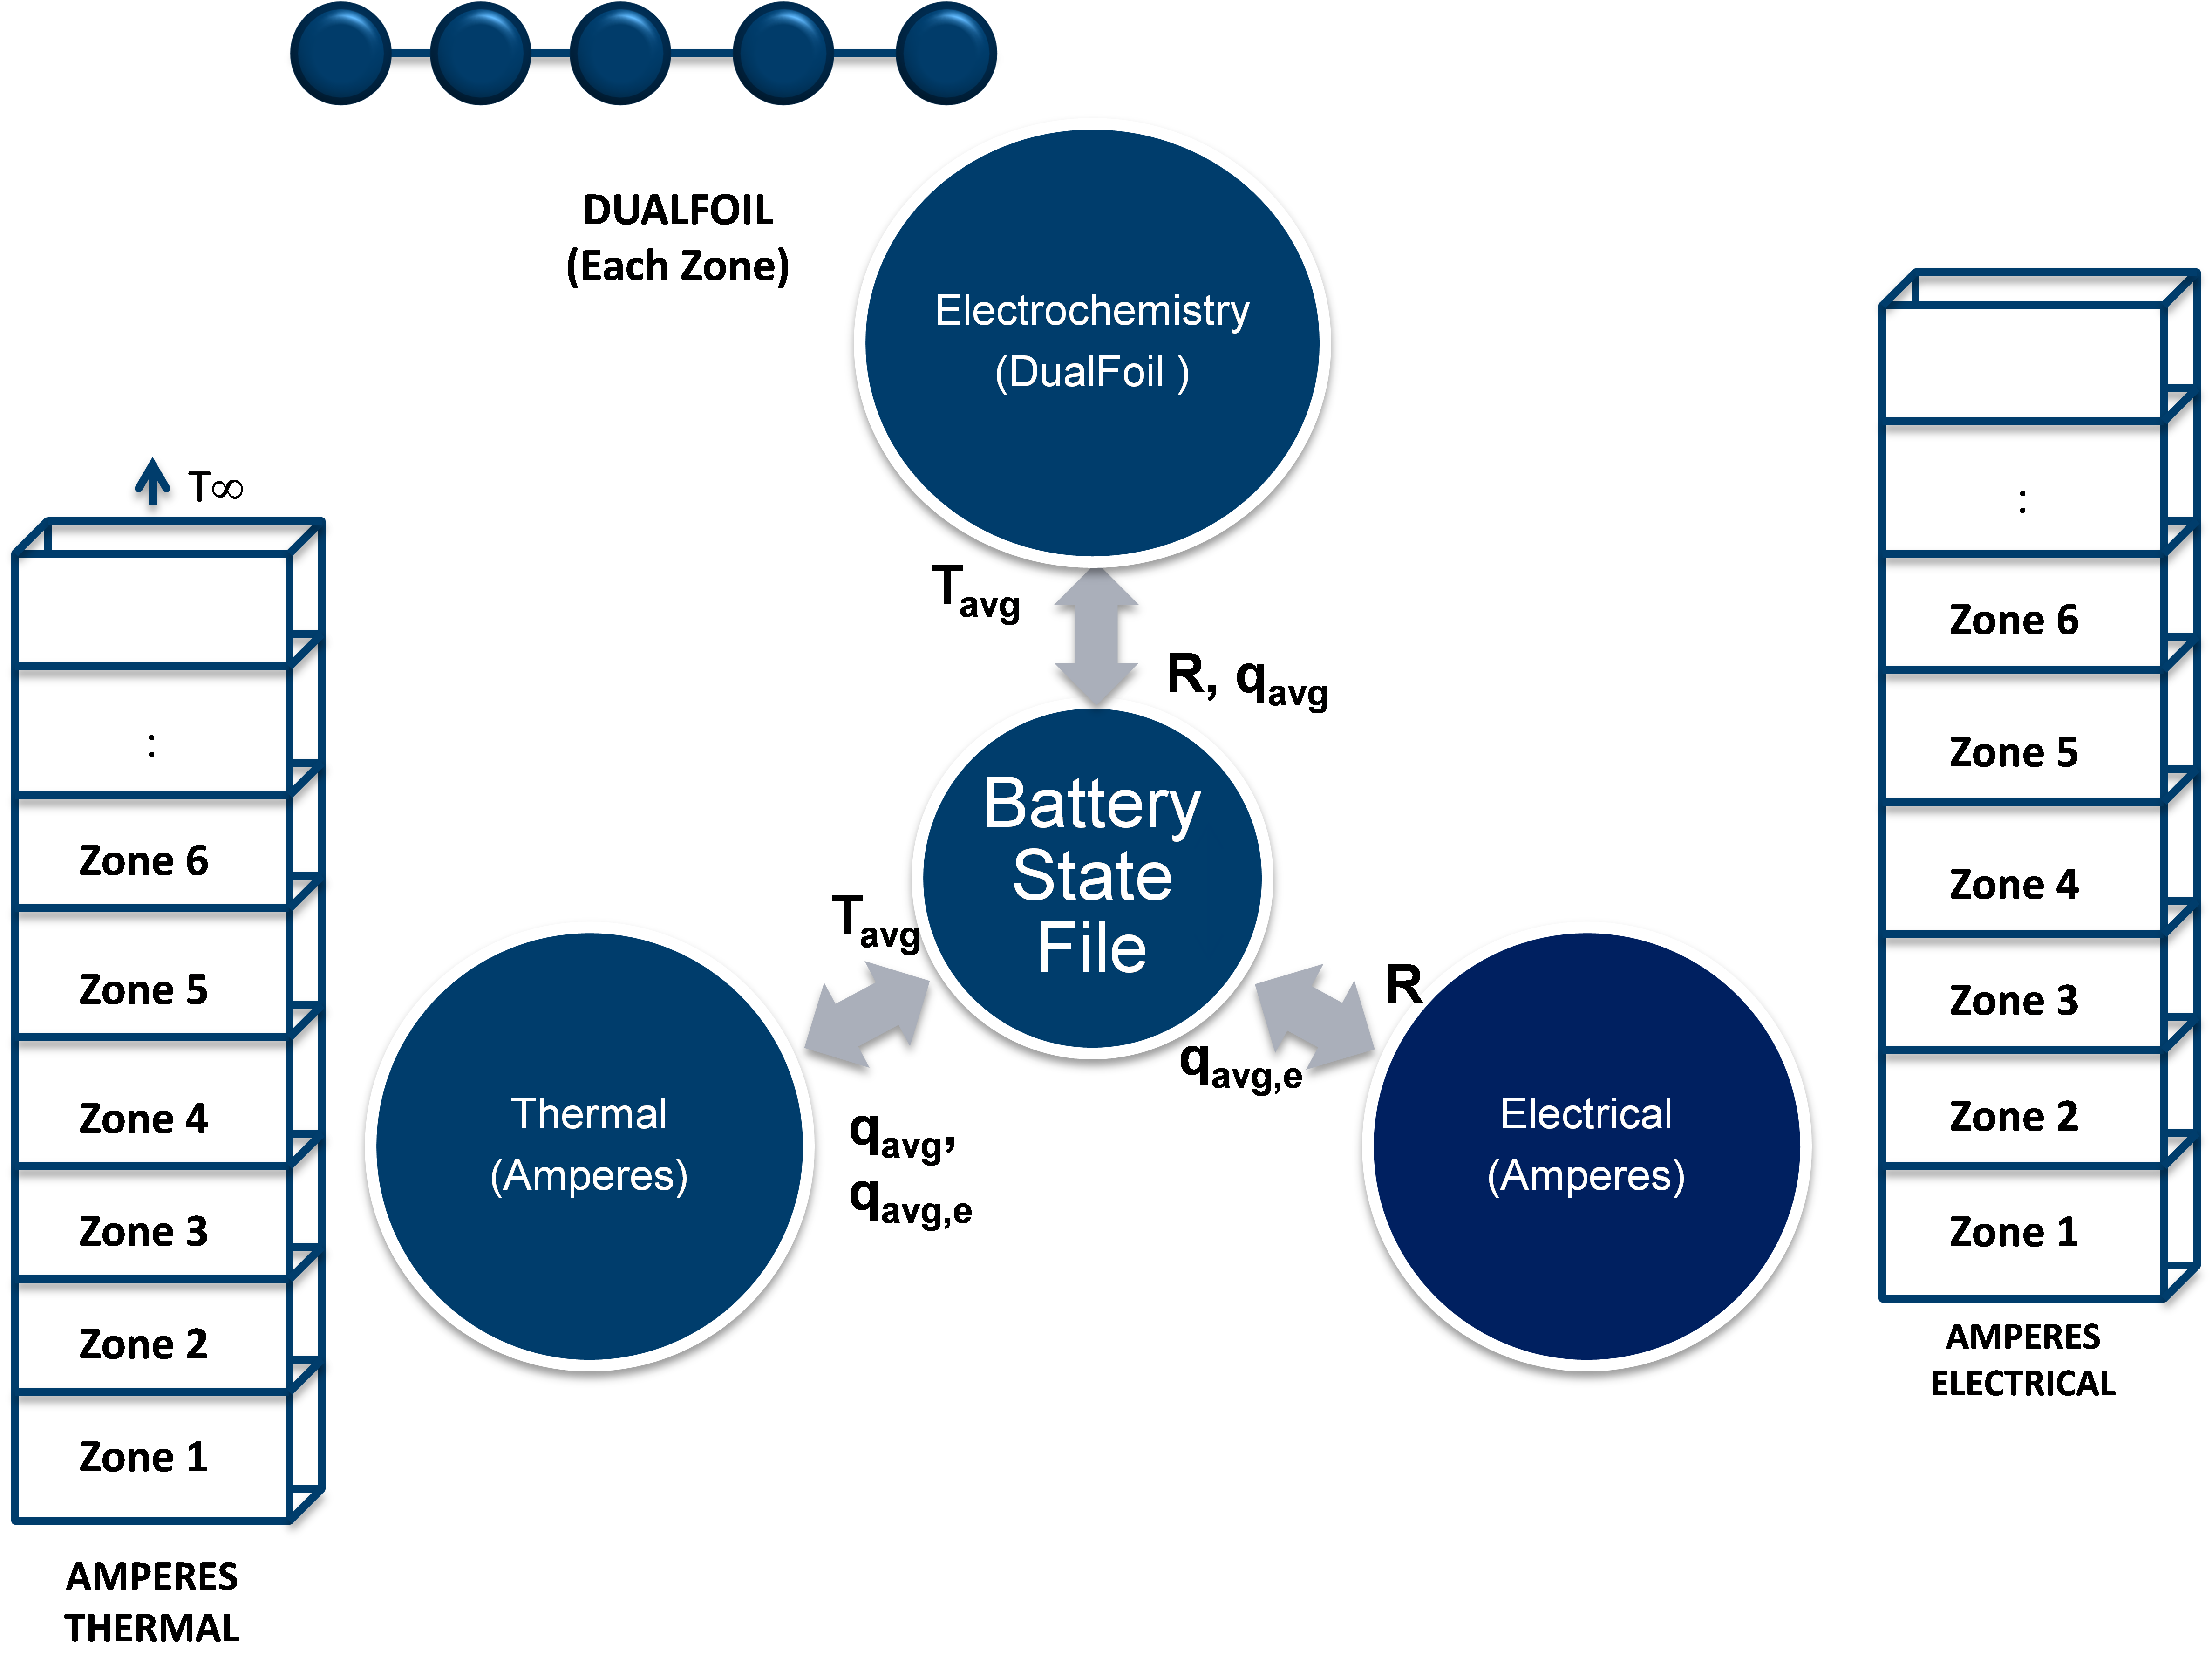
Figure 3: Battery state file for example 2.
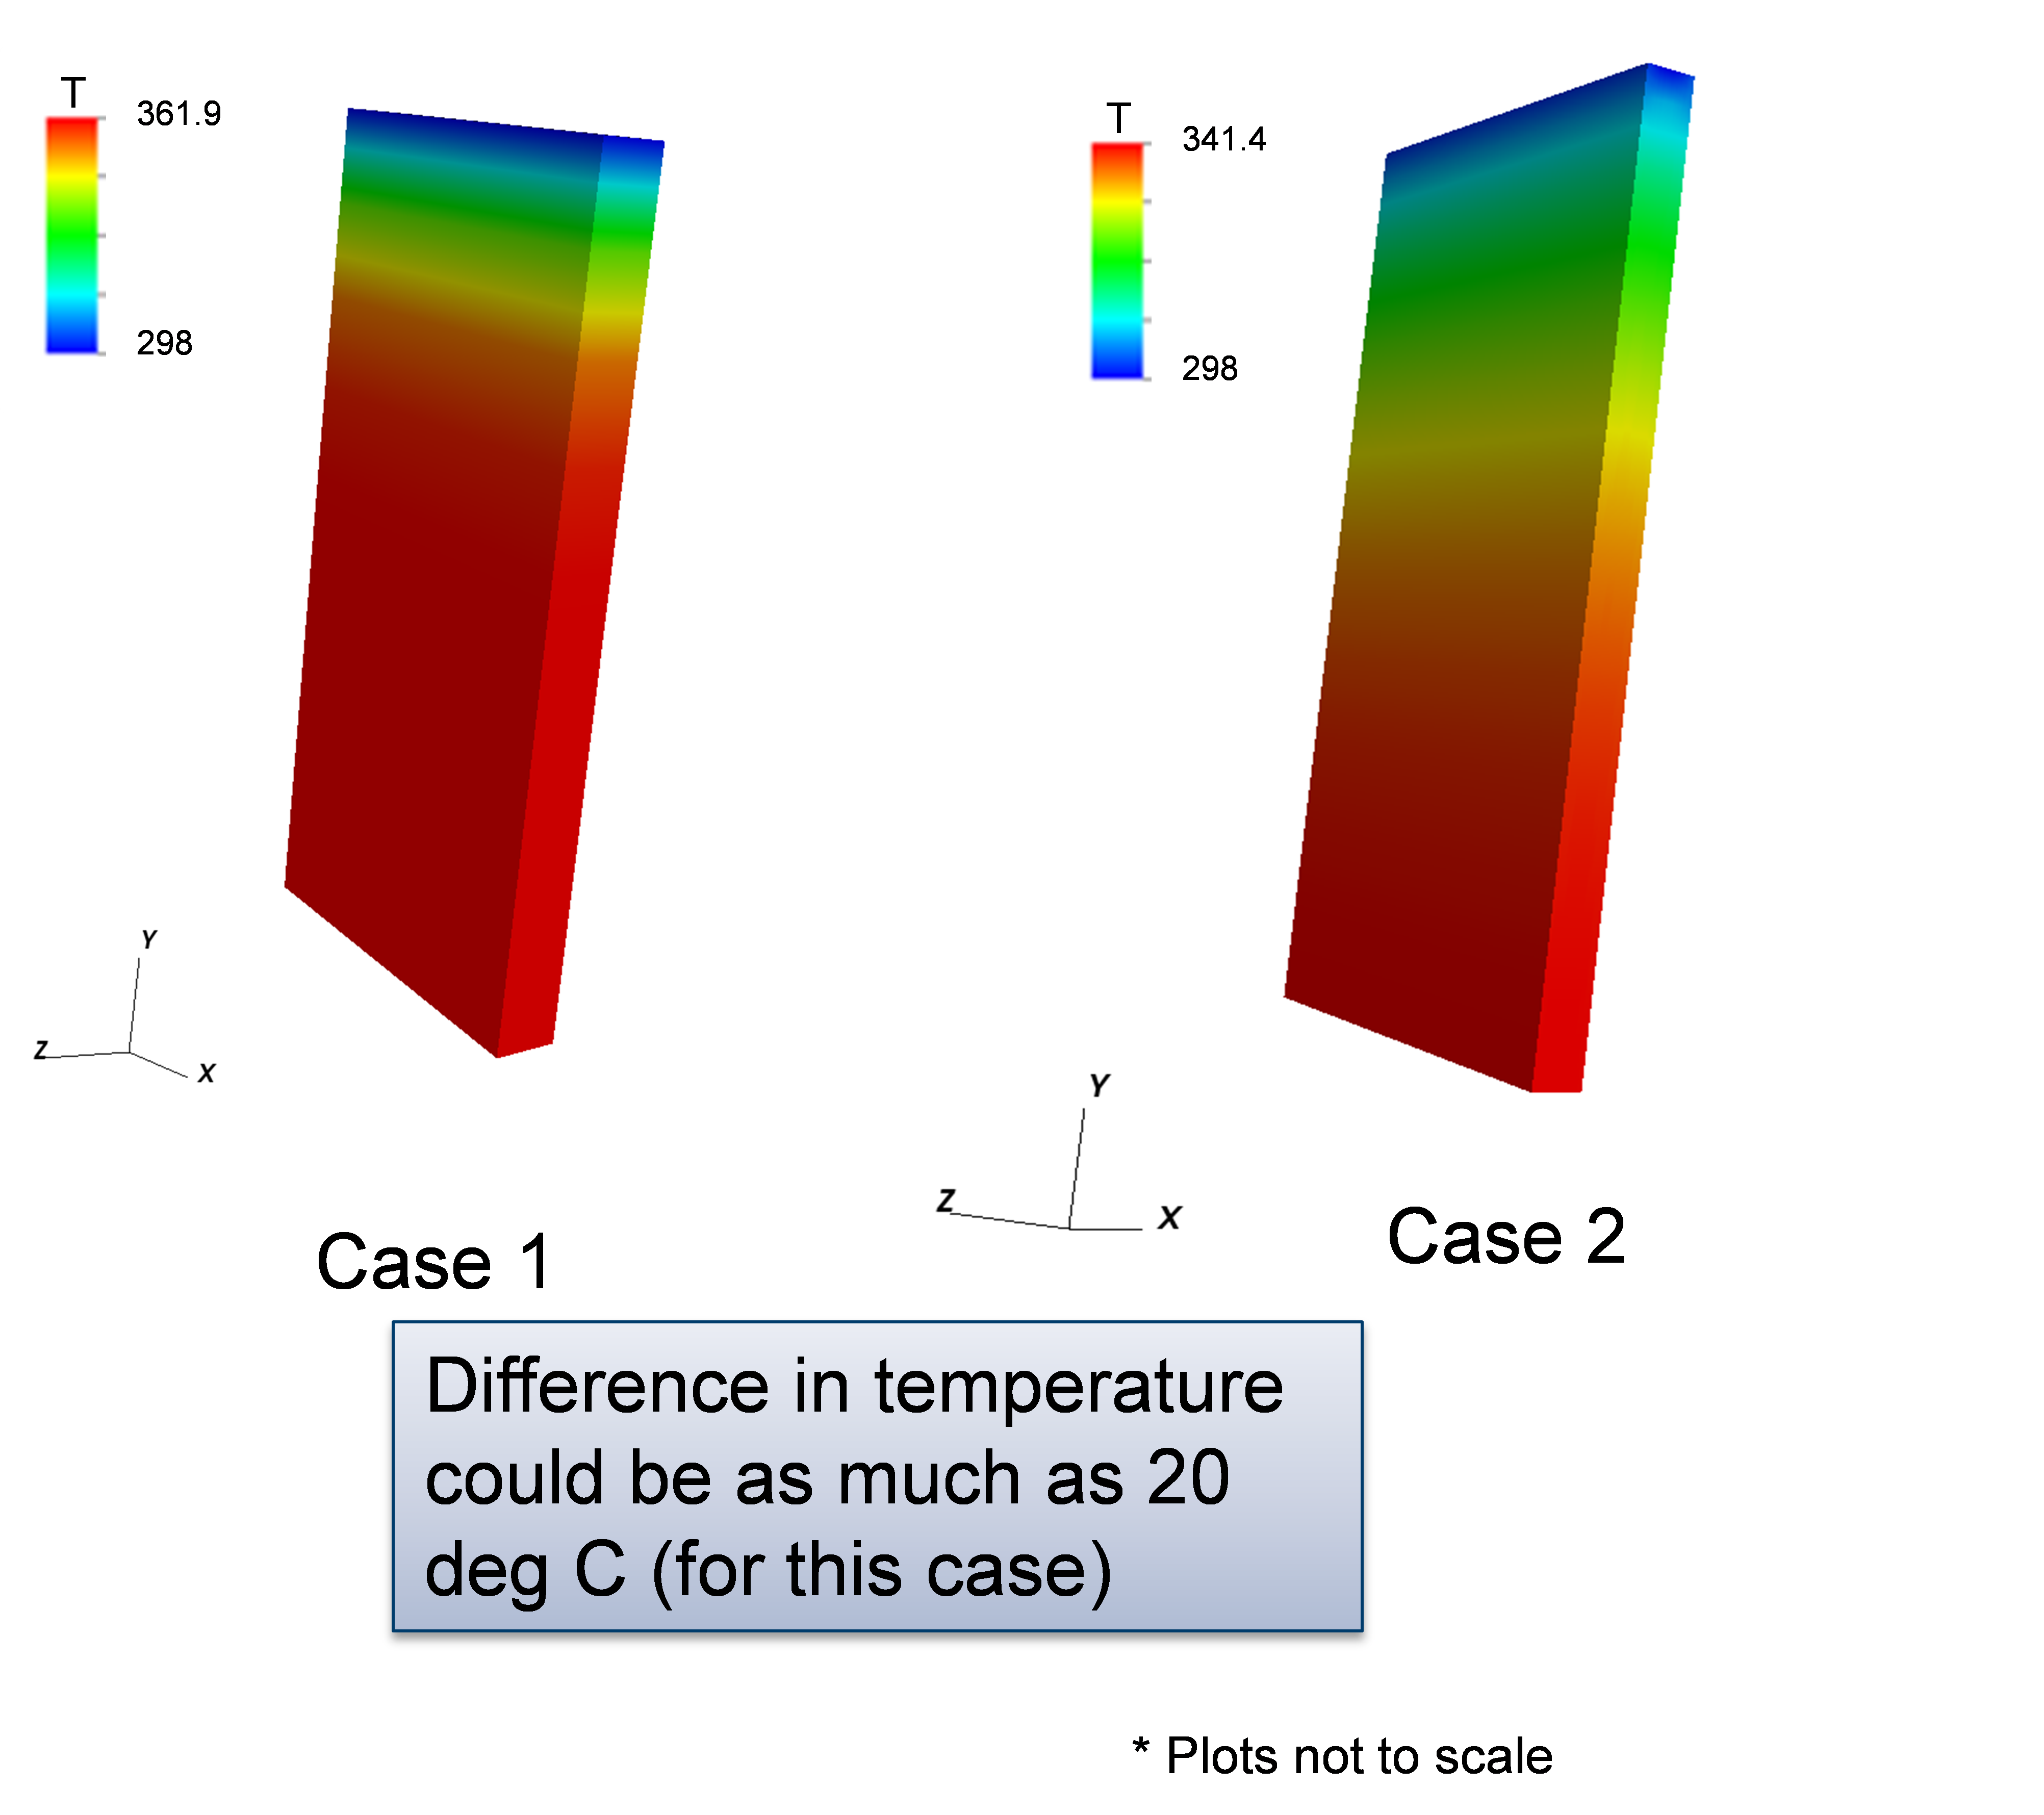
Figure 4: Sample results for example 2 comparing the temperature to that of case 1.
Example 3: Cylindrical Cell (Electrochemical/Electrical/Thermal)
This example (located in VIBE repository at trunk/examples/case3/) contains the same battery components as example 2 in a more complex geometry of a rolled cylindrical cell. The main model properties are given in the table below. Fig. 5 shows the geometry and the finite element mesh used to resolve the geometry of the cylindrical cell and the current collectors. The top hierarchy model has 168 (56 each for the cell-sandwich and positive and negative current collectors) zones in 4 quadrants. The zones describe different current collector and cell sandwich regions. The simulation uses 56 concurrent Dualfoil simulations for different cell-sandwich zones. Typical results are shown in Fig. 6. The maximum temperature occurs at the cell core as expected.
| Physical Properties | Units | Total | Carbon Electrode (Anode) | Lithium Electrode (Cathode) | Al Foil | Cu Foil | Separator |
|---|---|---|---|---|---|---|---|
| Density | kg/m3 | 2500 | 1500 | 2700 | 8960 | 1200 | |
| Heat Capacity | J/Kg-K | 700 | 700 | 900 | 385 | 700 | |
| Thermal Conductivity | W/m-K | 0.01 | 0.01 | 238 | 398 | 0.01 | |
| Electrical Conductance | S/m | 0.0051 | 0.0051 | 383x105 | 633x105 | 0.0051 | |
| (rCp) avg | J/m3-K | 175x104 | |||||
| Height | m | 0.05 | |||||
| Diameter | m | 0.02 | |||||
| Current Density | A/m2 | 35 | |||||
| Convective Heat Transfer Coefficient | W/m2-K | 25 |

Figure 5: Geometry and mesh of the simulated cylindrical cell
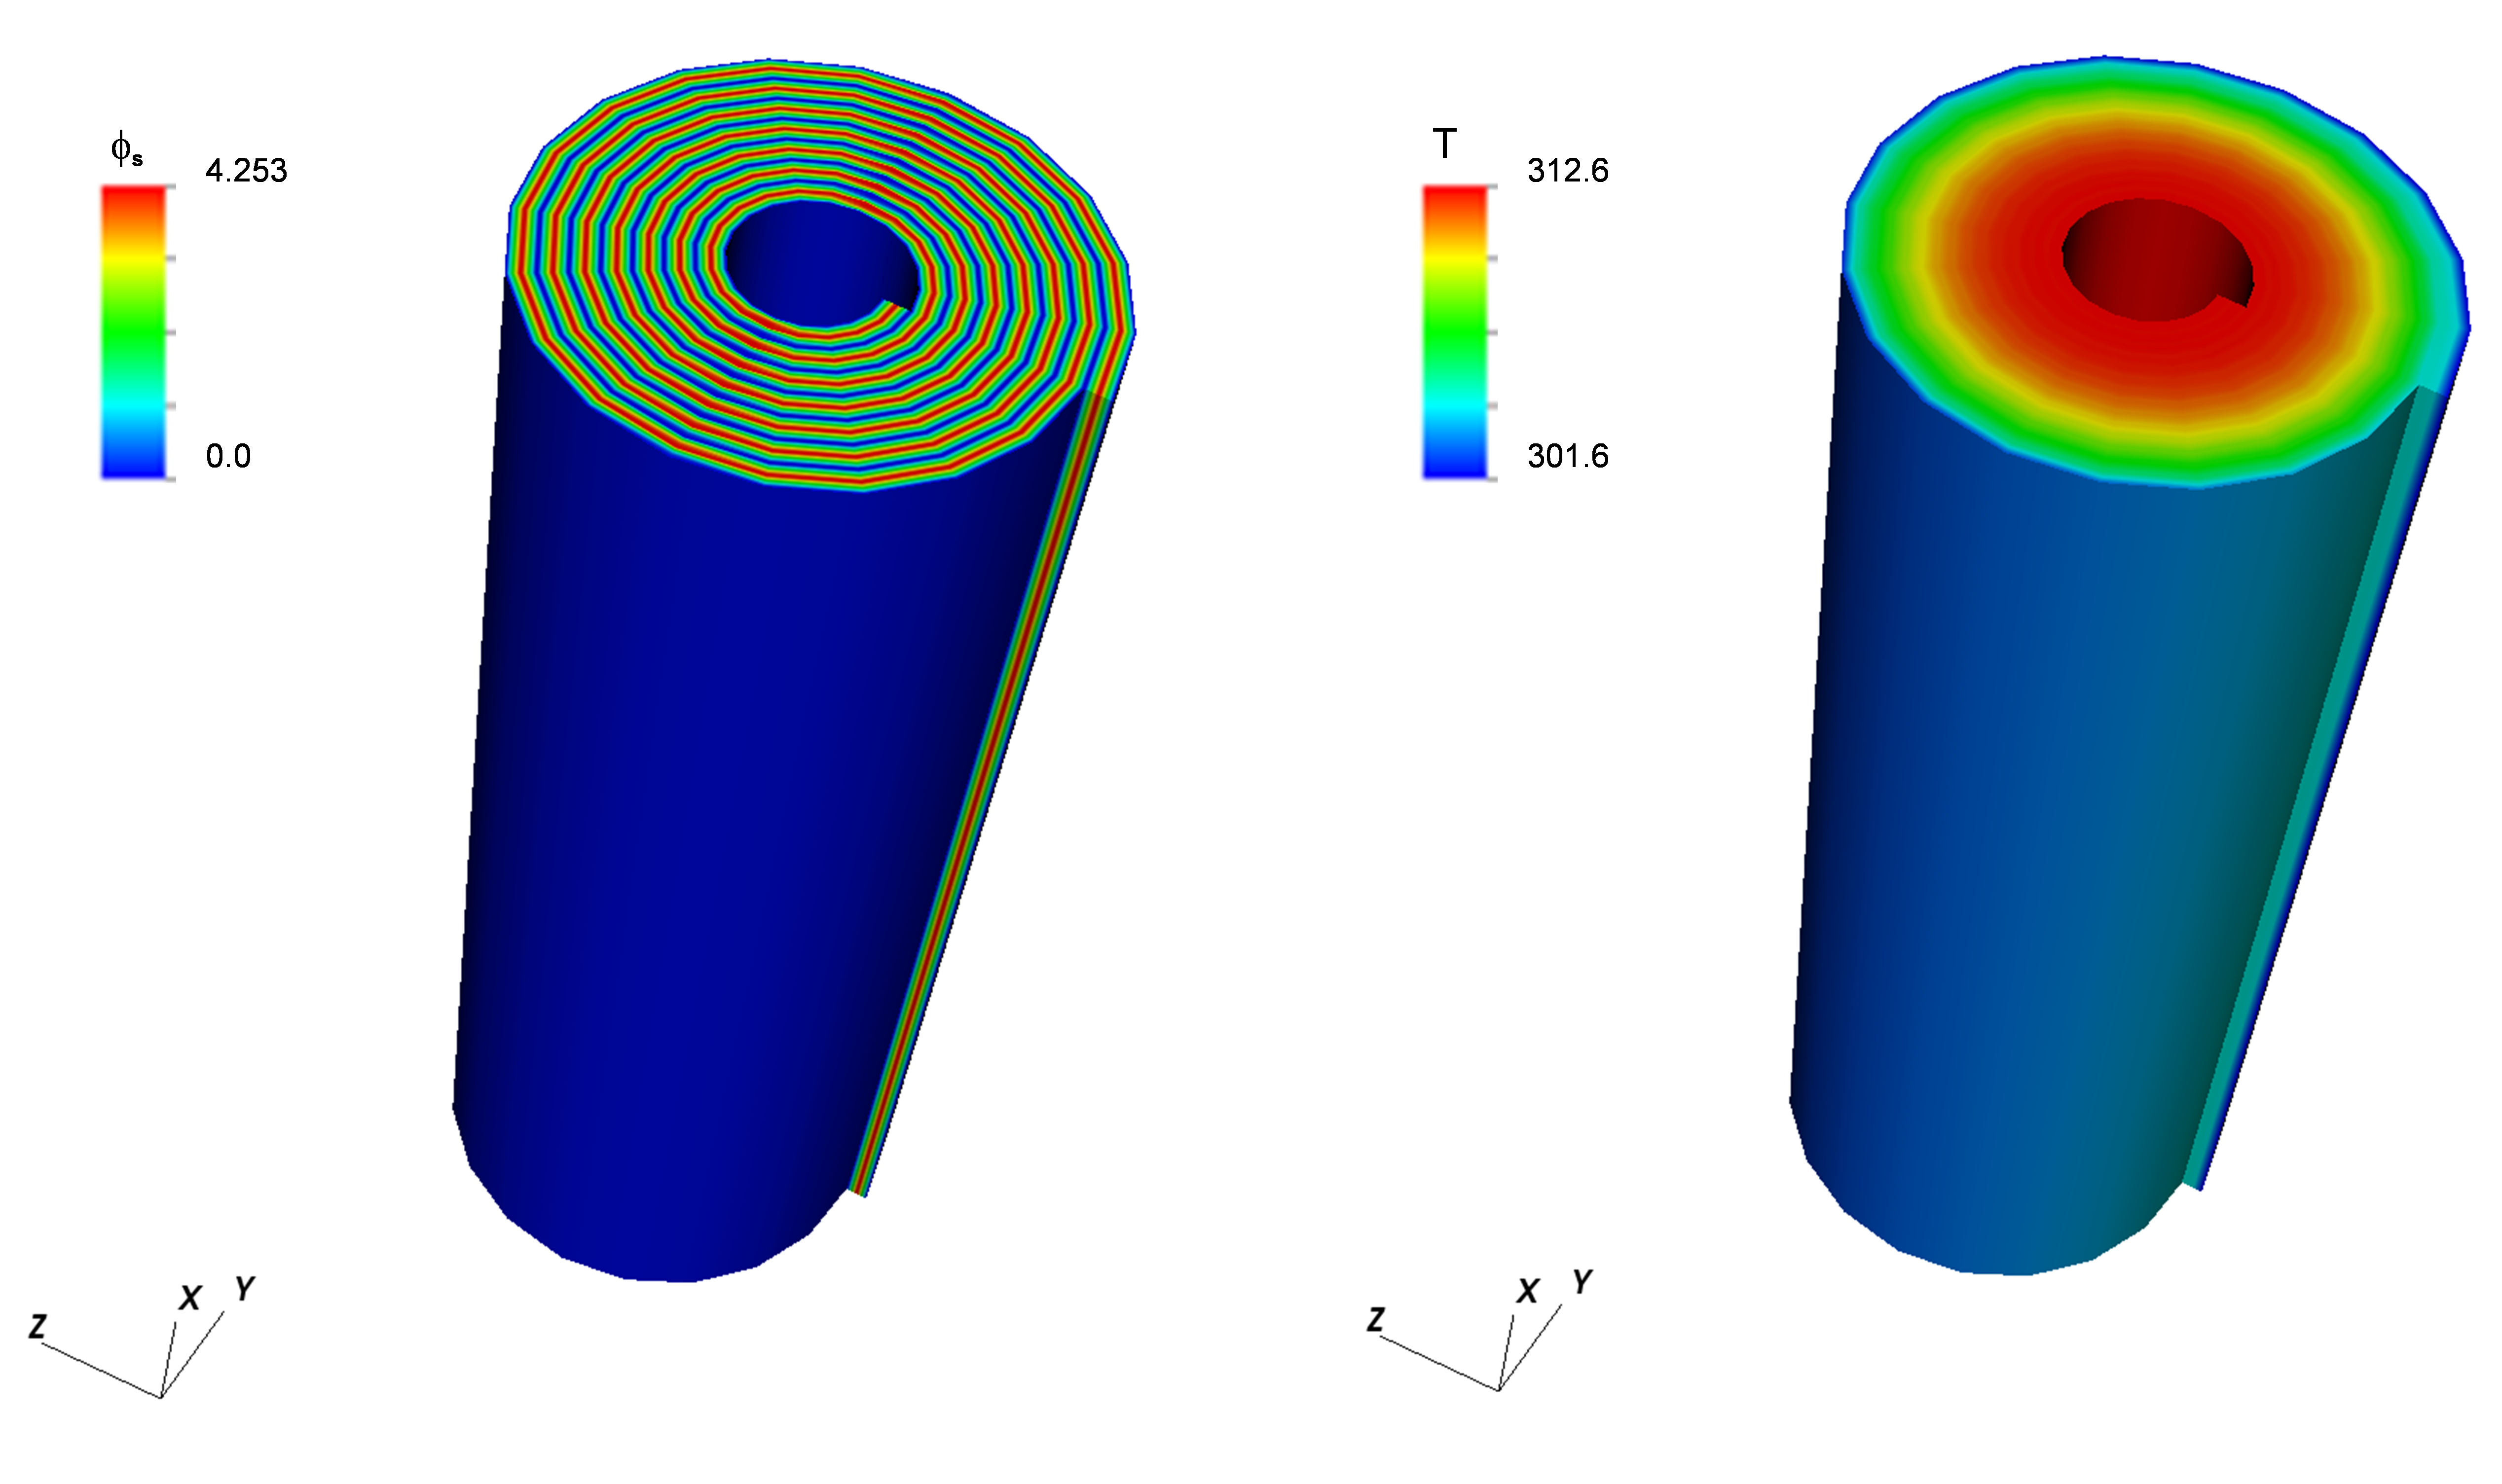
Figure 6: Sample results for example 3 (electrical potential on the left and the temperature on the right)
Example 4: Pouch Cell (Electrochemical/Electrical/Thermal)
This example (located in the VIBE repository at trunk/examples/case4/) contains the same battery components as example 3 with geometry of a prismatic pouch cell. The electrochemistry is modeled using the NTG model instead of the DualFoil model. Two different cases were simulated, one with one and the other with ten layers in the pouch cell. The model properties are provided below. The corresponding battery state is schematically given in Fig. 7. Typical results for the single layer and ten layer cases are shown in Fig. 8 and Fig. 9, respectively. As expected, the peak temperature increases with the number of layers and the highest temperature is at the core of the cell.
| Physical Properties | Units | Total | Carbon Electrode (Anode) | Lithium Electrode (Cathode) | Al Foil | Cu Foil | Separator |
|---|---|---|---|---|---|---|---|
| Density | kg/m3 | 2500 | 1500 | 2700 | 8960 | 1200 | |
| Heat Capacity | J/Kg-K | 700 | 700 | 900 | 385 | 700 | |
| Thermal Conductivity | W/m-K | 0.01 | 0.01 | 238 | 398 | 0.01 | |
| Electrical Conductance | S/m | 0.001449 | 0.001449 | 383x105 | 633x105 | 0.001449 | |
| (rCp) avg | J/m3-K | 175x104 | |||||
| Height | m | 0.192 | |||||
| Width | m | 0.145 | |||||
| Thickness | m |
1.7x10⁻³ (10 layers) |
|||||
| Current Density | A/m2 | 35 | |||||
| Convective Heat Transfer Coefficient | W/m2-K | 25 |

Figure 7: Battery state file for example 4.
Example 4a: Single layer of a pouch cell (Electrochemical/Electrical/Thermal)
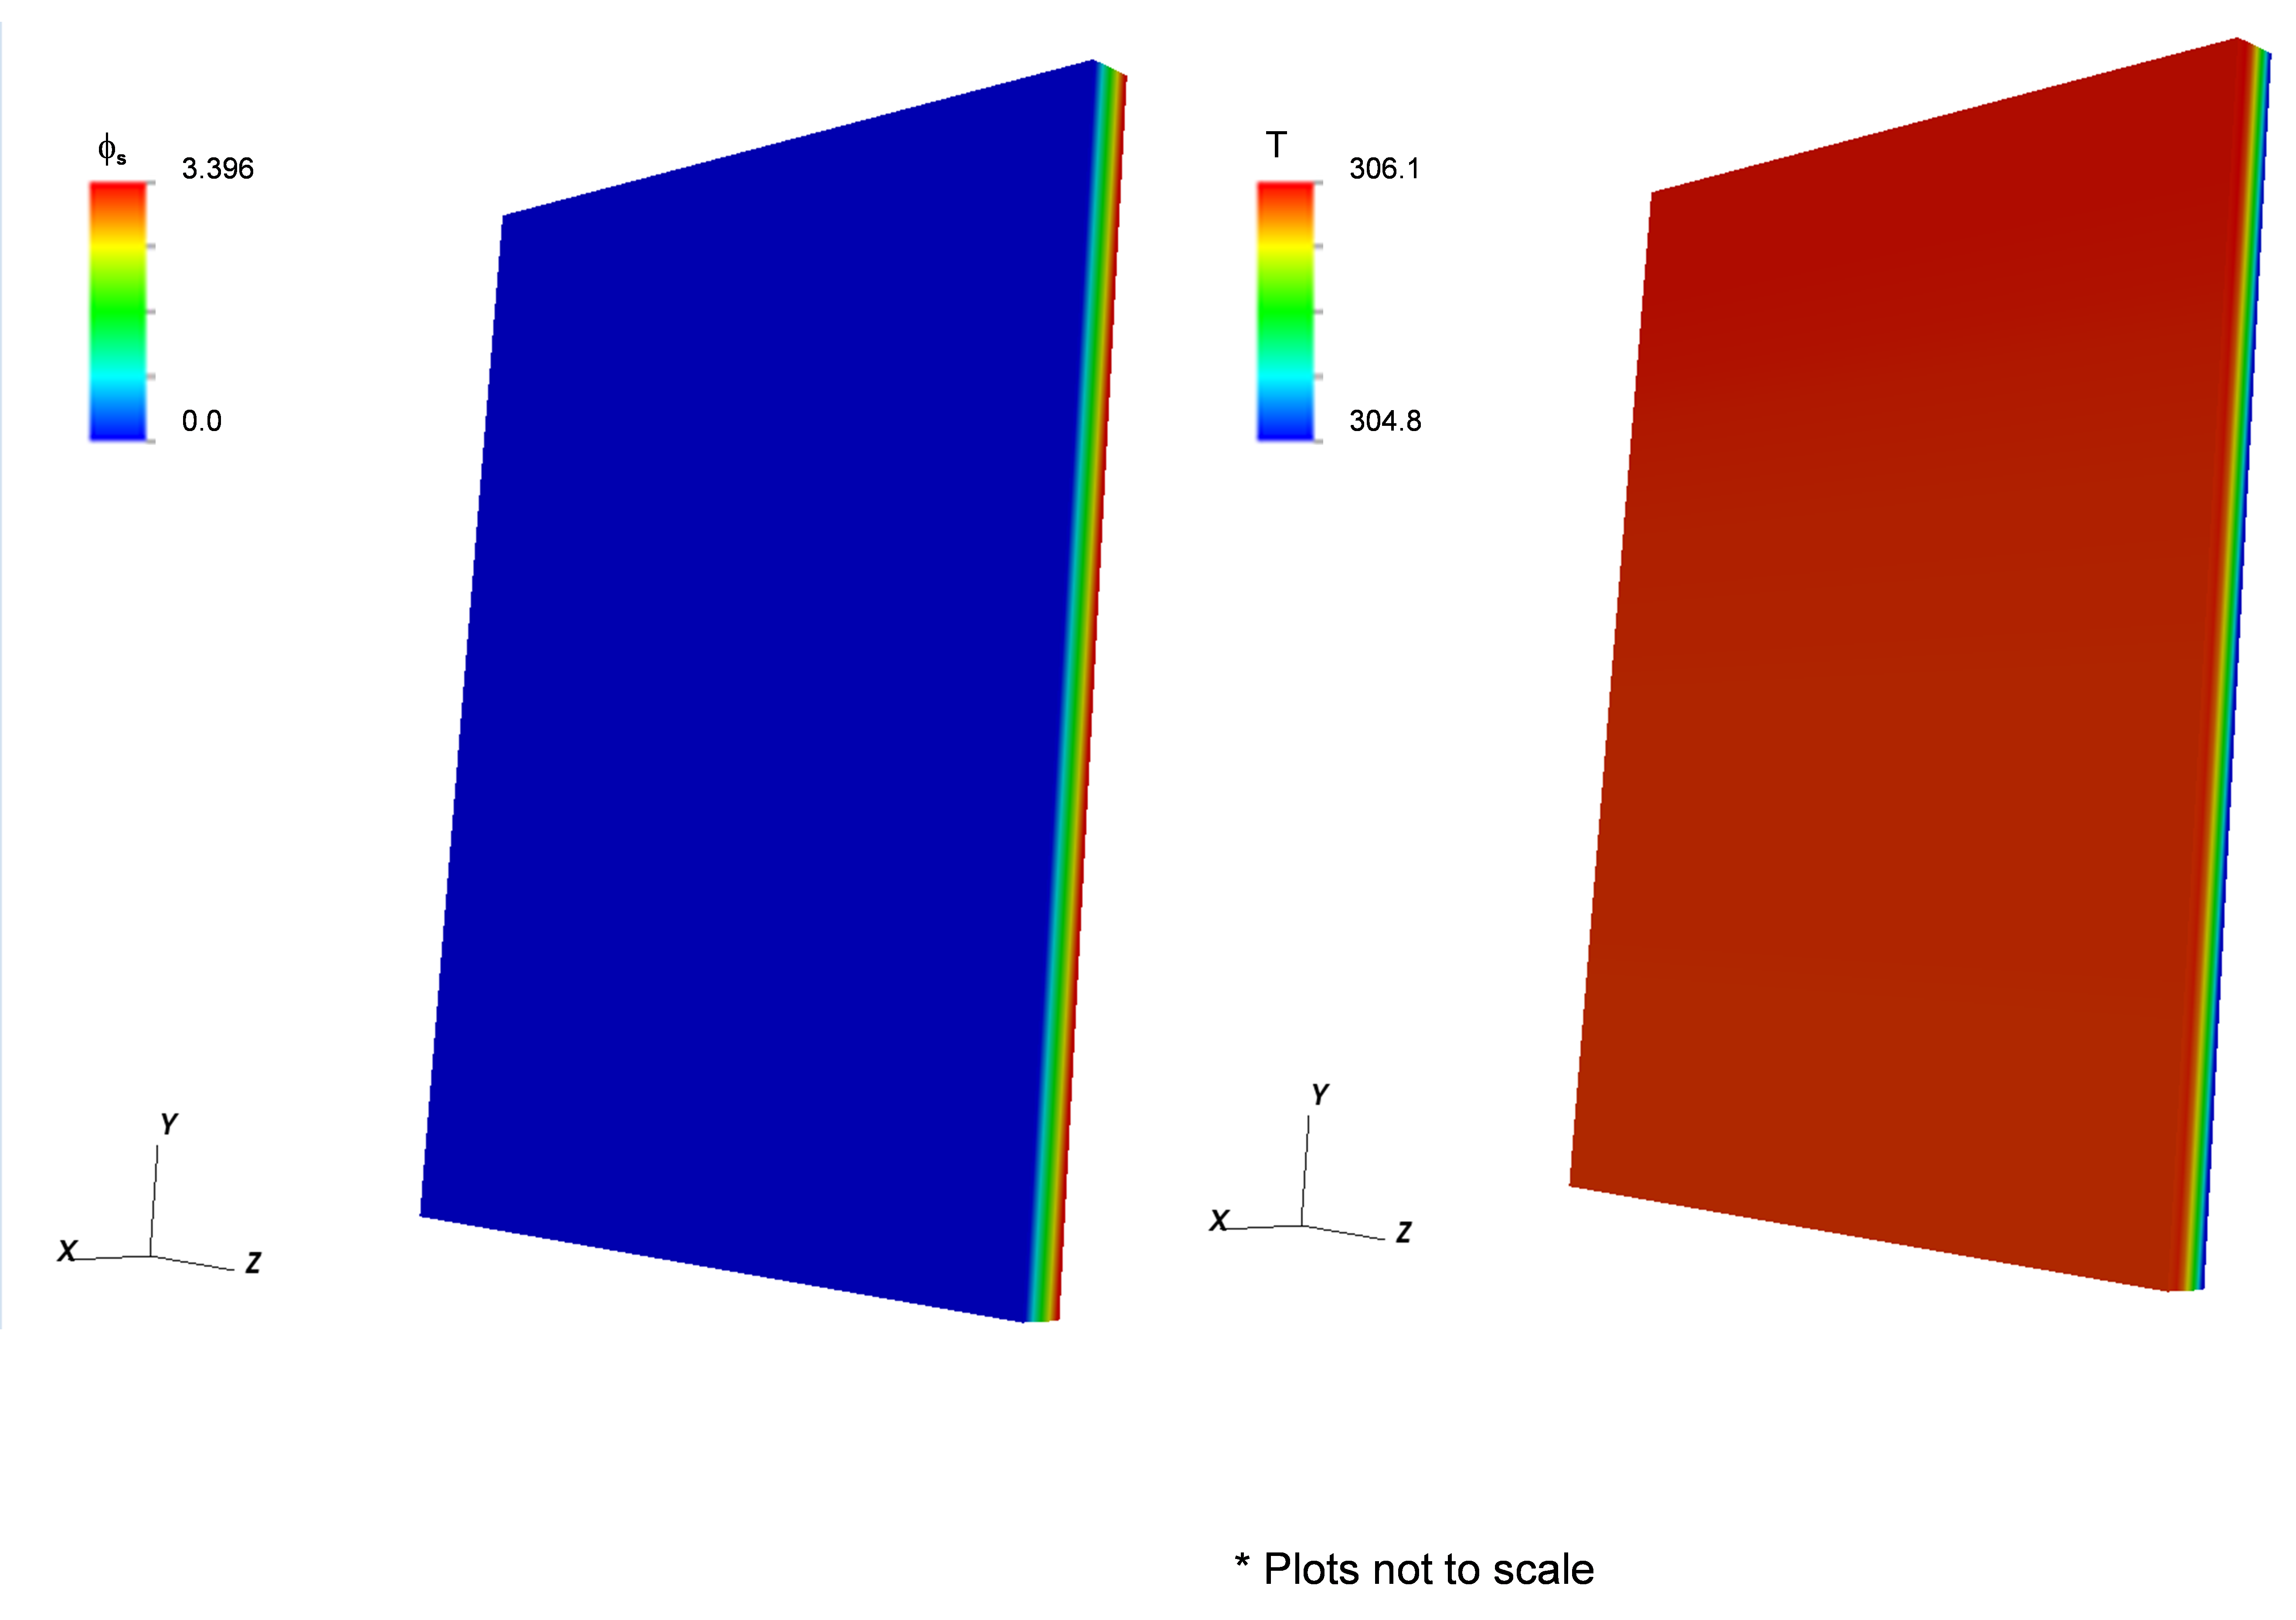
Figure 8: Sample results for Example 4a that shows the electrical potential (left) and temperature (right).
Example 4b: Multiple layers of a pouch cell (Electrochemical-Electrical-Thermal)

Figure 9: Sample results for Example 4a that shows the electrical potential (left) and temperature (right).
Example 5: Simple Design Optimization
We have also integrated integration of the DAKOTA (Design Analysis Kit for Optimization and Terascale Applications) optimization and sensitivity analysis toolkit from Sandia National Laboratories into the OAS framework (Eldred). DAKOTA toolkit provides a flexible, extensible interface between analysis codes and iterative systems analysis methods. DAKOTA contains algorithms for optimization, uncertainty quantification, reliability, and parameter estimation. All the capabilities in DAKOTA can be leveraged through the CAEBAT OAS framework once the components are interfaced to OAS and a simple example is located in the VIBE repository at trunk/examples/case5/and more details of this integration are documented in an upcoming publication (Elwasif, Bernholdt et al. 2012).
References:
Eldred, M. S. DAKOTA, a multilevel parallel object-oriented framework for design optimization, parameter estimation, uncertainty quantification, and sensitivity analysis: Version 4.1 reference manual.
Elwasif, W. R., D. E. Bernholdt, et al. (2012). Parameter Sweep and Optimization of Loosely Coupled Simulations Using the DAKOTA Toolkit. International Conferences on Computational Science and Engineering, Paphos, Cyprus, IEEE.